![]()
Click the figures in the blue squares
to follow the content of the guidance.
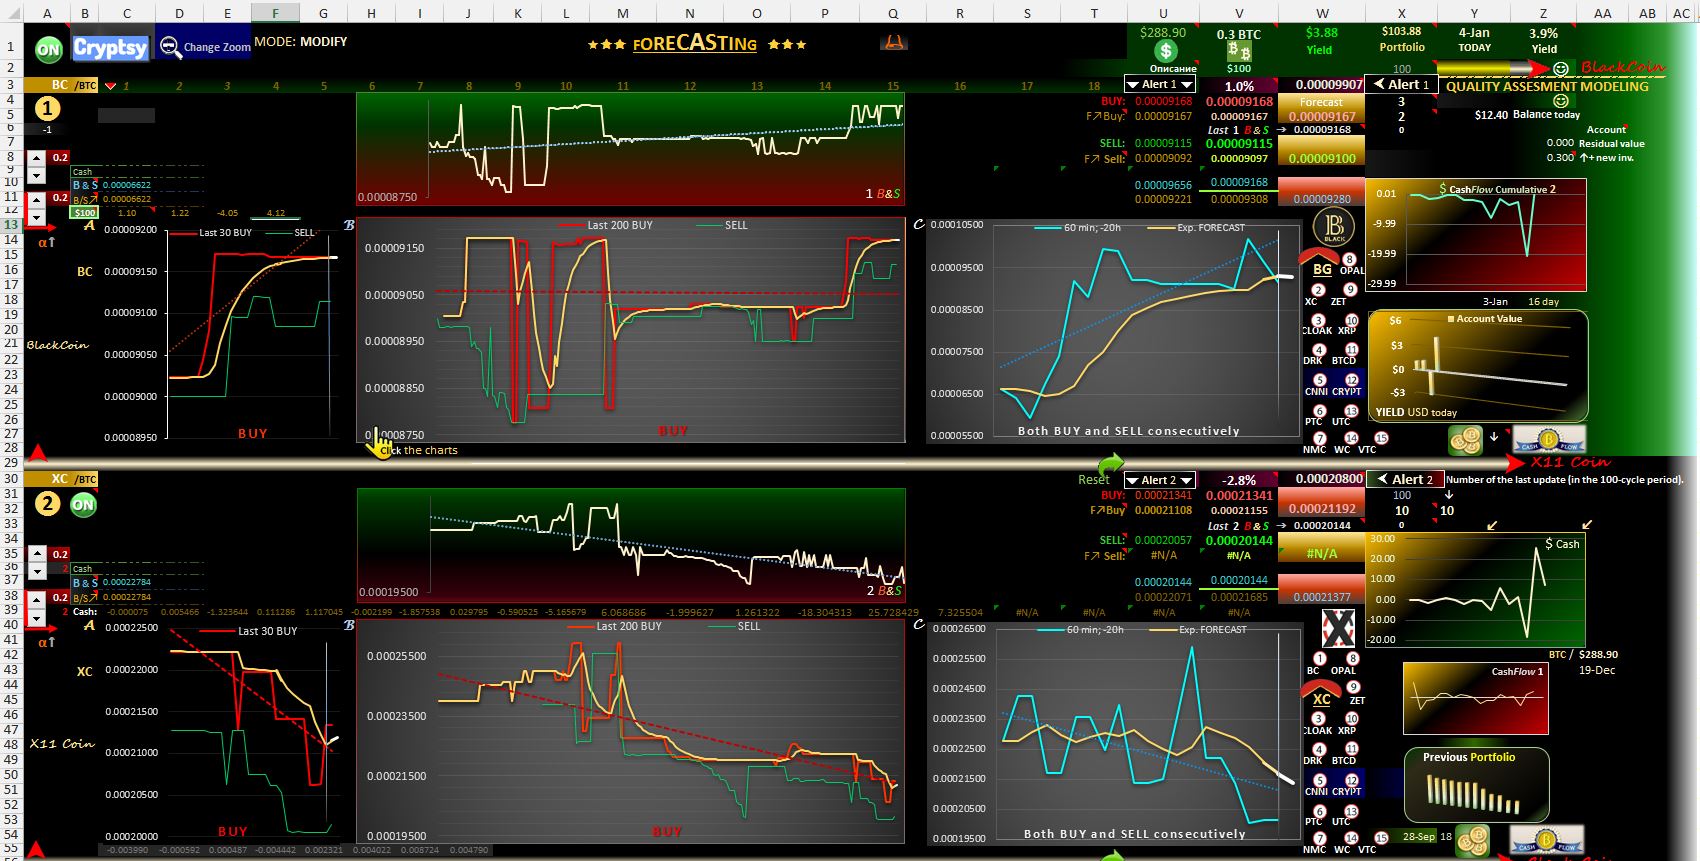
. 2. Options about the functional form of this program file. Select Cell G1. A Combo Box proposes general change of the MODE: MODIFY or TRADE—stop updating or updating charts "A" and "B" only, periodically every 6 min all the time. NOTE: In MODIFY you can work with the file without being affected by long-term permanent updating. However, you can update all the charts once by Button ON or selected single chart as click the big logo button of the selected coin. It creates greater convenience when analyzing trade this coin and need its refresh at that moment.
.
3.
Quality Assessment Modeling of the trading from the investment to the current date.
![]() enters the exchange rate BTC / USD (in case the systen does not allow its atomatic import).
enters the exchange rate BTC / USD (in case the systen does not allow its atomatic import).
![]() This button is to insert a new investment amount that was entered in Cell V1. The next Cell W1 to the
right presents the real yield in USD at the current day as difference between the Account Value (Estomated) and the investment amount in USD
in the cource of the day (Cell X1). Cell Z1 presents this yield in percentage. If it is positive one or negative, it is indicated by happy or unhappy
icons below. The same indication is just below the first one, refereing current balance of the trading Isee (see Item
.5. below).
This button is to insert a new investment amount that was entered in Cell V1. The next Cell W1 to the
right presents the real yield in USD at the current day as difference between the Account Value (Estomated) and the investment amount in USD
in the cource of the day (Cell X1). Cell Z1 presents this yield in percentage. If it is positive one or negative, it is indicated by happy or unhappy
icons below. The same indication is just below the first one, refereing current balance of the trading Isee (see Item
.5. below).
. 4. Control the number of updates—automatically when the program works in MODE "TRADE"; or manual updates by Button ON for all coins, or by the big icon button once for any single currency —those for all three charts "
A", "B" and "C"; as well as the Chart "C" every hour authomatically.. 5. Section "Quality Assessment Modeling" is the next upper level of the hierarchical structure of the control (see more in this Section below). The most important is the real cash you have today due to the trading, in USD.
.
6.
Fields of table data
- the last two valuse of the series plus the forcast values (in white color on the charts). The first (red) row of eack
coin section is the last 30 buy values for the coins, presented on this section (on the above examplary picture these are Blackcoin
![]() and V11 Coin
and V11 Coin
![]() .
Next is the Weighted Moving Averages (WME) graph of buy. Below follow the last 30 sells and their WME graph. The Exponential
Smothings (in yellow) for both graphs, Last BUY and Last SELL, can be trated by
Spin Buttons (see Item 7 below). And the last third set of rows presents the third column of charts C—the
consecuence of Last BUY and Last SELL 200 deals during the last 20 hours.
The red / green lines under the last values (Col V) shadow define this value to a BUY or a SELL last transaction. It is standed in for further operations in Cell V6, V33, etc.
.
Next is the Weighted Moving Averages (WME) graph of buy. Below follow the last 30 sells and their WME graph. The Exponential
Smothings (in yellow) for both graphs, Last BUY and Last SELL, can be trated by
Spin Buttons (see Item 7 below). And the last third set of rows presents the third column of charts C—the
consecuence of Last BUY and Last SELL 200 deals during the last 20 hours.
The red / green lines under the last values (Col V) shadow define this value to a BUY or a SELL last transaction. It is standed in for further operations in Cell V6, V33, etc.
. 7. Both Spin Buttons (Form Contol) change the Exponential Smothing constant (in default = 0.2) for quickly adjusting of the forecasts in compliance with the specific form of the graphs B and C.
.
8.
The small chart "$ CashFlow
Commulative 2" is updated after each trading period (day).
The following chарт below is is a sequence of
yields computed for consecuence of periods of time.
The next below shows the win / loss within the same period.
. 9. The most inportant charts for deceision making in the trading. For each one coin the last 100 trades are visible in two options—BUY only values with its forecasting on the background of SELL graph, and the oposit SELL, both interchabgeable through click over any chart A or B of the same coin.
.
10.
The Big icon - coin logo—(i) Indicates type of currency; (ii) Button
that refreshes the all tables and graphs of thos coin only.
Small icons—Buttons that move the screen to fix its first line at the top of the screen; very confortable for browsing the coins.
. 11. Chart "Cash" shows the current balance in USD rate of BTC of the day.
.
12.
The Button
![]() moves the screen to ScrollRow 327 -
OPERATIONAL BLUE AREA.
moves the screen to ScrollRow 327 -
OPERATIONAL BLUE AREA.

.
13. Button
![]() . When click it a black shield appears over the chart. It contains info data supposing
an expected development of the chart. The actual part of the chaet remains hidden by the shield. This is a traning gear how to plan the trader's deceision making.
. When click it a black shield appears over the chart. It contains info data supposing
an expected development of the chart. The actual part of the chaet remains hidden by the shield. This is a traning gear how to plan the trader's deceision making.
.
14.
Button
.
15.
Three bottons type "Reader" redirect to supporting manuals.
The second one,
Section QUALITY ASSESSMENT MODELING (This section is currently in reconstruction)
.
16.
Buttons BUY
.
17. The Cell Y411 admits the pasted of the recent portfolio value, copied from the
Cryptsy site, called "Account Value (Estimated)". The Button, that run this procedure, is on the top of the worksheet - Cell X1.
.
18. Cash฿Flow
.
19. Cell X411 and Cell Z411
admit the inported BUY and SELL values from your Cryptsy's Web page "Trades" for further automatic distribution to the right places in
the respective columns as herein above shown.
Our behavior as homo ludences—the trading on the exchange is game playing. For monitoring and further control of the profitability of your investments
here is appled the highest mat-logical level of interpretation of unpredictable events of interest and sensitibity analyses of the cash inflow. Finally,
the last/highest level of exchange market trading is the
semi-automatic operation. It is subject of next step of development of this trading facility.![]() runs procedure "C
Export". It is only applicable if you use a constantly updating such a
file online on a second computer ot on our server through OneDrive.
runs procedure "C
Export". It is only applicable if you use a constantly updating such a
file online on a second computer ot on our server through OneDrive.![]() in
Bulgarian (for English click there the flag-icon
in
Bulgarian (for English click there the flag-icon
![]() ), describes the nature of this OPERATIONAL BLIE AREA.
), describes the nature of this OPERATIONAL BLIE AREA.
Topic TRADING PROFITABILITY AND SENSITIVITY ANALISES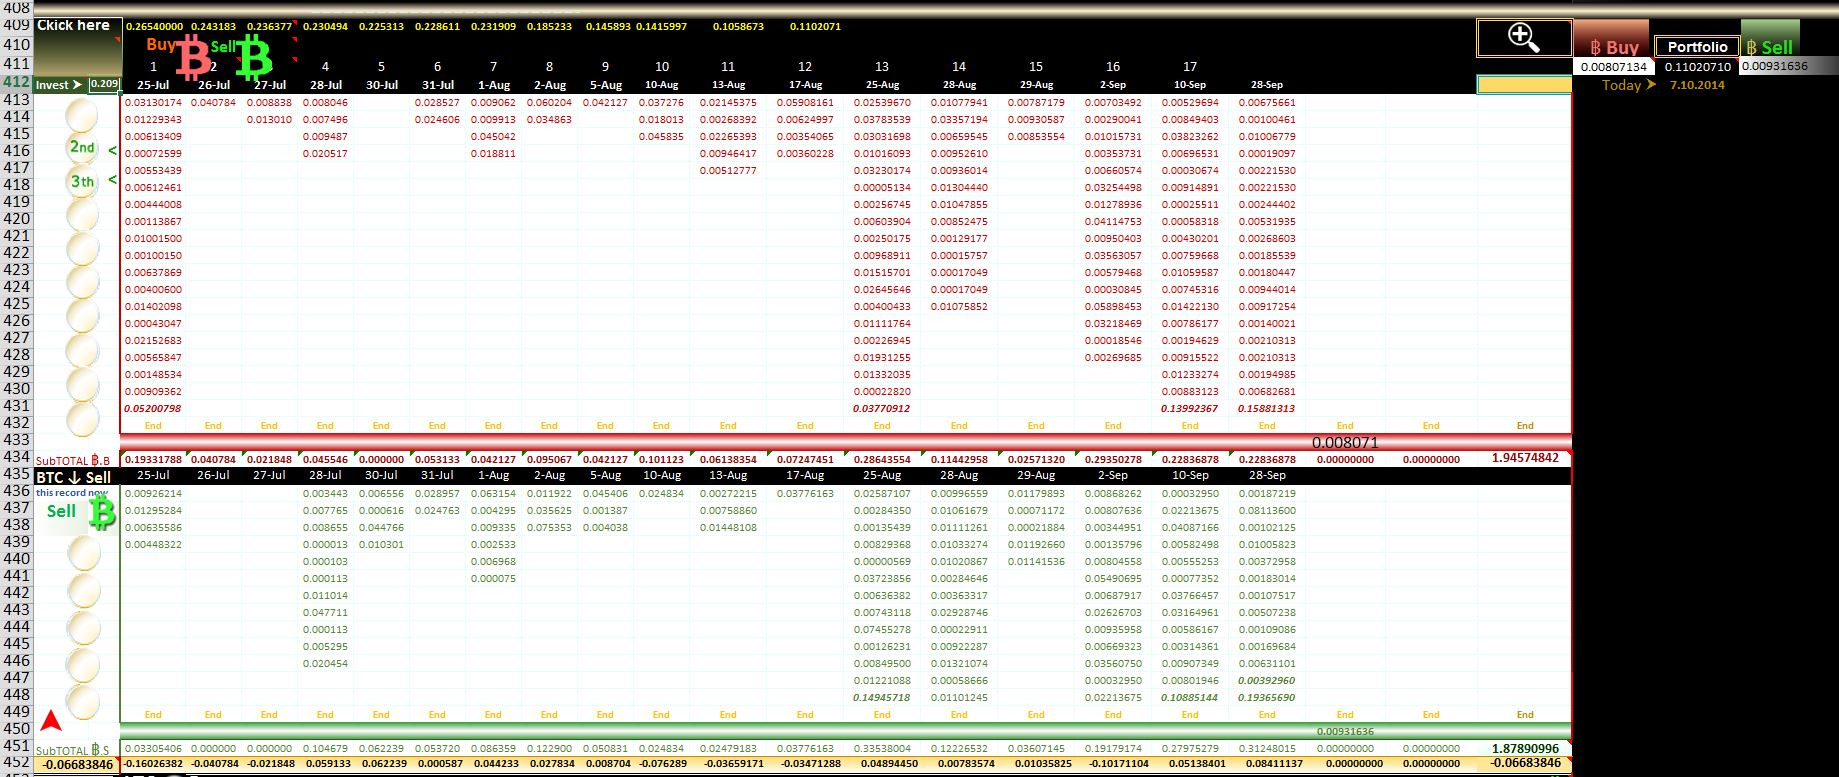
![]() and SELL
and SELL
![]() BitCoins.
They are for automatic import and complete the respective tables with manually copyed data from page "Trades" of the Cryptsy Exchange
Website for the day of trading. This is the basic information for computing and construction of charts of cash-flow, cash-flow cumulative and other
characteristics of quality assessment of the trading for a certain periods of time.
BitCoins.
They are for automatic import and complete the respective tables with manually copyed data from page "Trades" of the Cryptsy Exchange
Website for the day of trading. This is the basic information for computing and construction of charts of cash-flow, cash-flow cumulative and other
characteristics of quality assessment of the trading for a certain periods of time. ![]() Button. A ScreenUpdating buttons at every coin section
which is scrolling the screen down to Row 408 wherefrom you can operate and control entering data about
BUY and SELL performed orders provided from the Cryptsy's Website.
They are to be used for QUALITY ASSESMENT MODELING. Thus you can monitor and later control the quality / results of your trading.
show
Button. A ScreenUpdating buttons at every coin section
which is scrolling the screen down to Row 408 wherefrom you can operate and control entering data about
BUY and SELL performed orders provided from the Cryptsy's Website.
They are to be used for QUALITY ASSESMENT MODELING. Thus you can monitor and later control the quality / results of your trading.
show